Take a look at how InvictaTM helps you with generating accurate & high-quality alt text for your images.


PARABOLIC CURVE GRAPH
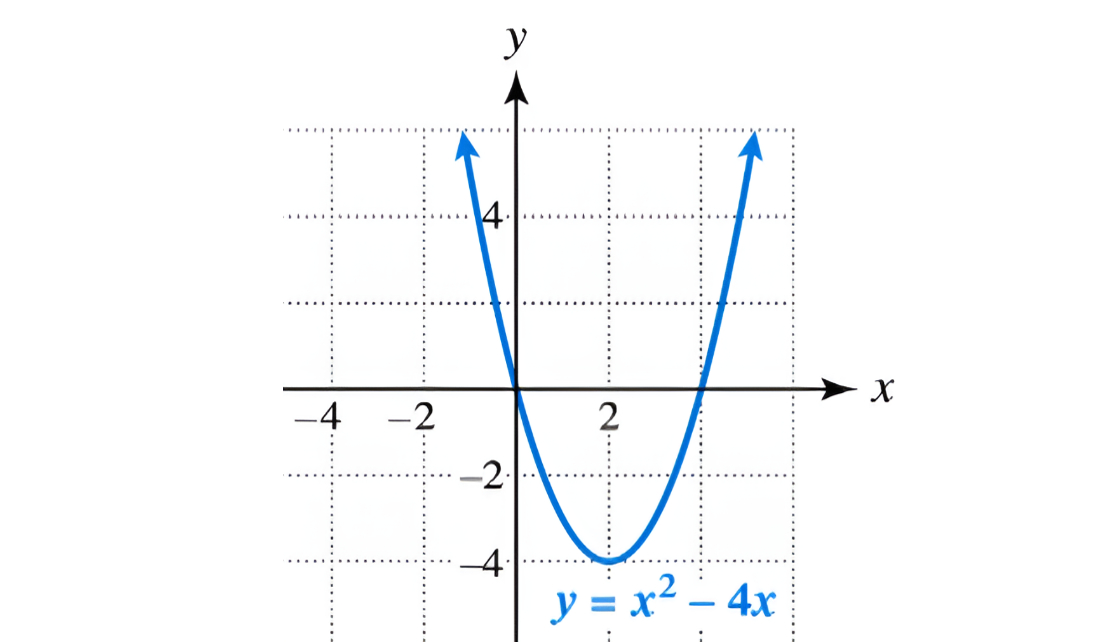
The figure shows a parabolic curve. The equation of the parabola is y equals x squared minus 4 x. The parabola goes through the origin in a coordinate plane.
Time taken: 4-6 mins | Cost: $2-$5*
*Cost range based on market surveyThe figure shows a curve. The curve is labeled y equals x squared plus 4 x. The horizontal axis is labeled x and the vertical axis is labeled y. The markings negative 4, negative 2, and 2 are shown on the horizontal and vertical axis. The parabola passes through (0,0), (2, negative 2), and (4, 0). The equation of the parabola is y equals x squared minus 4 x.
Time taken: 4-6 mins | Cost: $2-$5*
*Cost range based on market surveyA vertical parabola that opens up is graphed on the coordinate plane. The horizontal axis is labeled x and ranges from negative 4 to 4 in increments of 2 units. The vertical axis is labeled y and ranges from negative 4 to 4 in increments of 2 units. The parabola enters the viewing window in the second quadrant, passes through (negative 1, 6), (0, 0), the vertex (2, negative 4), (4, 0), and (5, 6), and then exits the viewing window in the first quadrant. The equation of the parabola is y equals x squared minus 4 x.
Time taken: Seconds | Cost: 50% reduction in rates
Invicta'sTM highly trained generative AI technology guarantees a better user experience by providing meaningful alt text which is concise & lowers the cognitive load.
Combining the power of generative AI with human expertise, InvictaTM creates customized, error-free alt text with a staggering accuracy rate of ~95% across thousands of images.
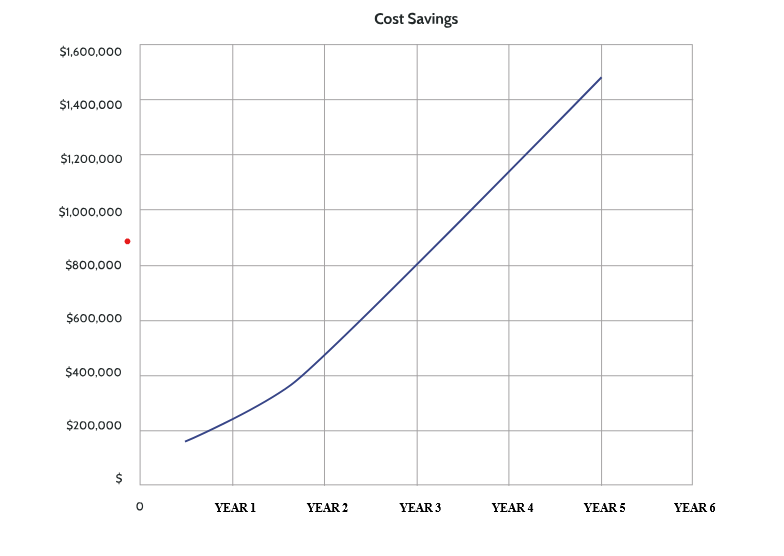
Whether it is legacy content, updating editions or new content, the speed at which InvictaTM generates alt text reduces the time to market by up to 60% compared to manual approaches of creating alt text.
Don’t lose months or years in making your online content accessible. Powered by deep learning, InvictaTM allows for accelerated training of new images with minimal human involvement and is designed to scale more efficiently, based on your needs.
CHEMISTRY
| Manual Authoring Time | Time Taken by InvictaTM |
|---|---|
| Manual authoring*: 10 to 30 minutes | Invicta™ processing time**: In seconds |
| Manual editing*: 8 to 15 minutes Manual quality checks: 2 to 10 minutes | Editing and quality checks: 40-60% faster compared to manual processes |
| *More for complex images | **With the current server system, it can be scaled as per need |
Invicta’sTM deep neural network-based image processing is capable of extracting essential aspects from a diverse set of images. The resulting alt text helps explain complex content better, empowering learning for all and not just the specially abled.
ORGANIZATION HIERARCHY CHART
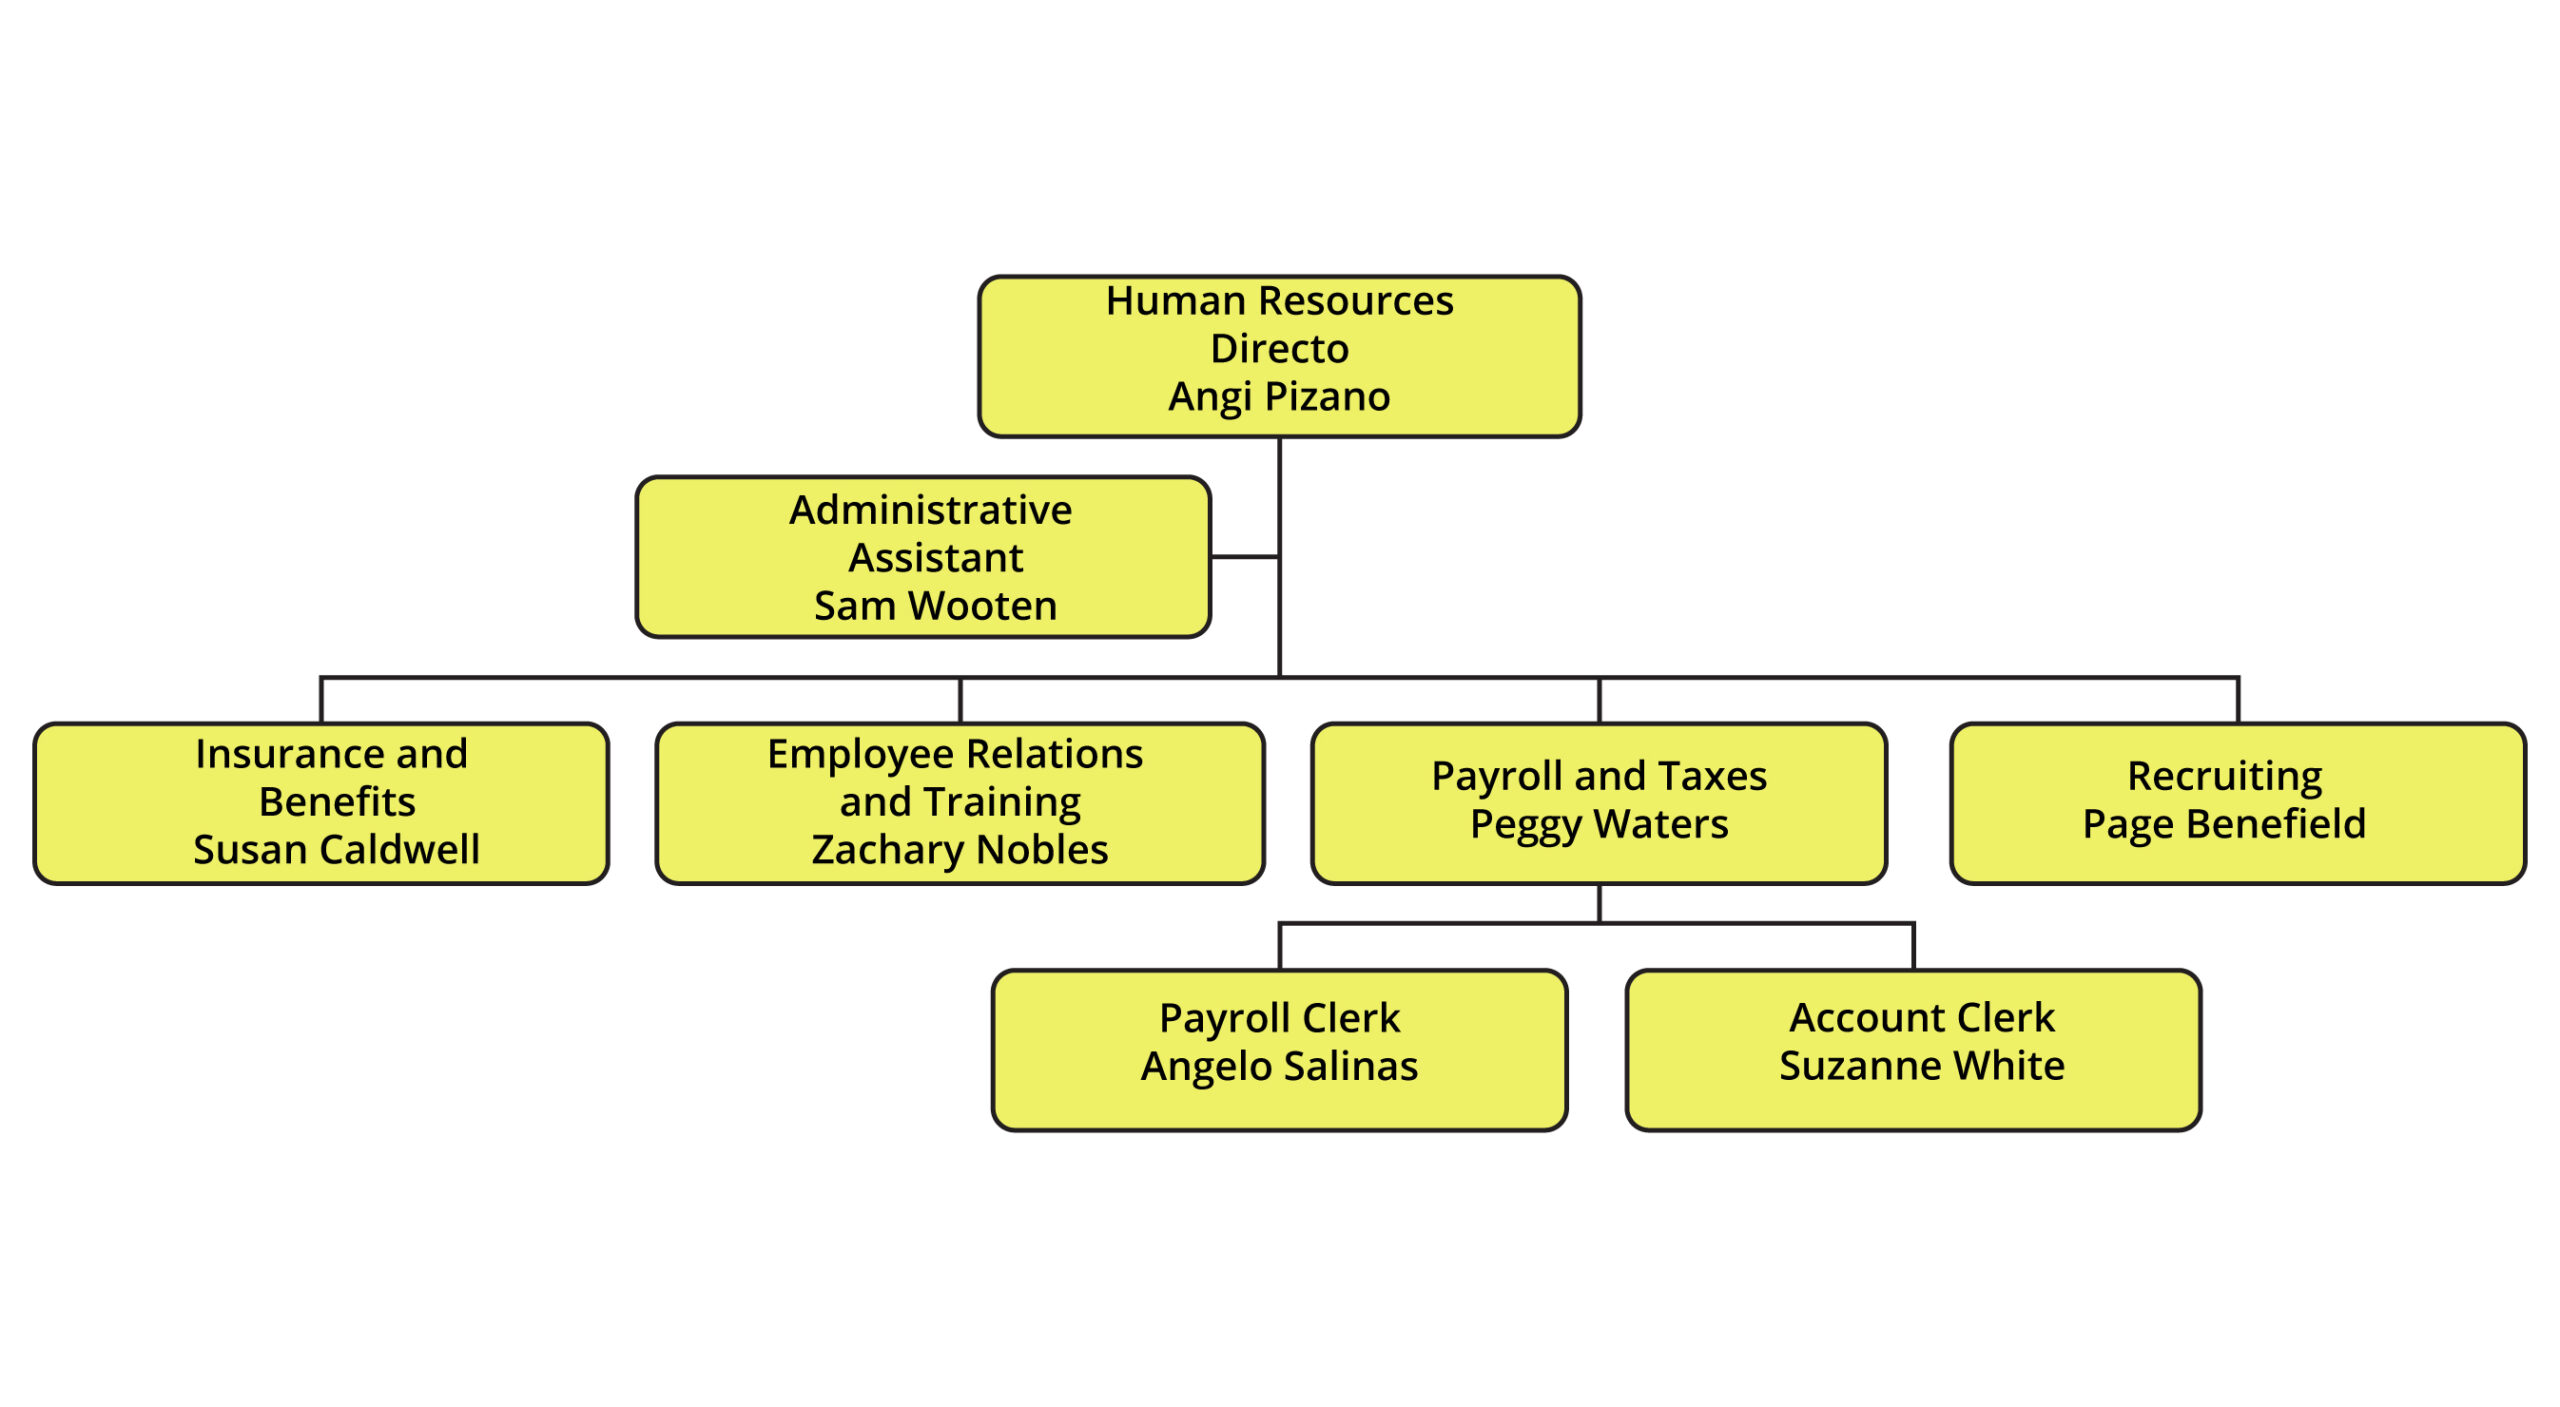
The question figure depicts an organizational chart representing employees at a sportswear company. The chart consists of four levels. "Human resources director, Angi Pizano" in the first level. In the second level, Administrative assistant, Sam Wooten reports to the Human resources director, Angi Pizano. On the third level, there are four departments with their heads. These departments report to the Human resources director in level 1. The departments with their heads in the third level from the left to the right are "Insurance and Benefits, Susan Caldwell," "Employee Relations and Training, Zachary Nobles," "Payroll and Taxes, Peggy Walters," and "Recruiting, Page Benefield." Payroll and Taxes under Peggy Walters has two employees under it at the fourth level. These are "Payroll Clerk, Angelo Salinas" and "Account Clerk, Suzanne White.
Time taken: Seconds | Cost: 50% reduction in rates
CHEMISTRY
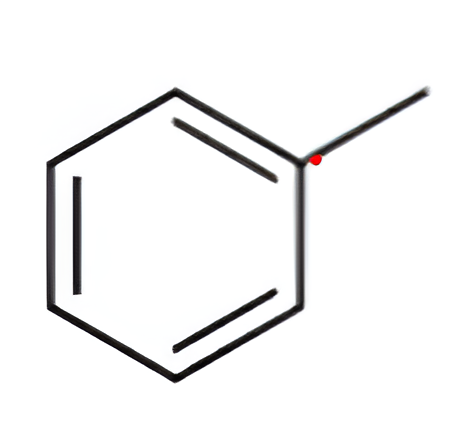
Time taken: Seconds |
Cost: 50% reduction in rates
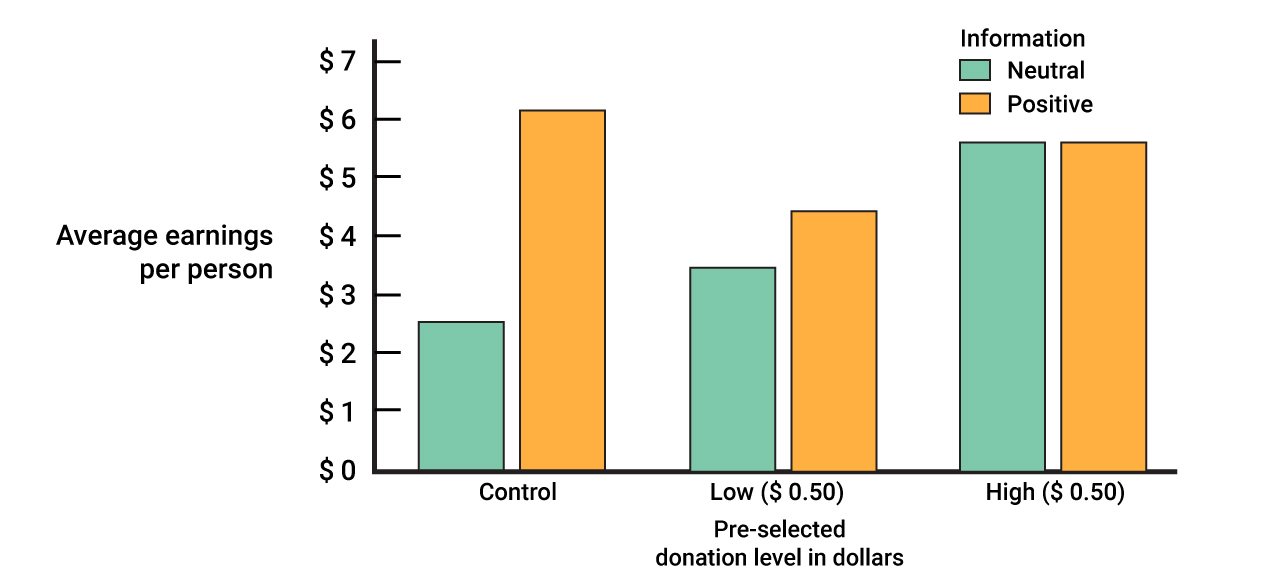
A vertically grouped bar graph depicts the pre-selected donation levels in dollars versus average earnings per person. The horizontal axis is labeled "Pre-selected donation level in dollars" and consists of 3 markings, Control, Low (0.50 dollars), and High (15.00 dollars). The vertical axis is labeled "Average earnings per person" and ranges from 0 to 7 dollars, in increments of 1 unit. In the key, a blue bar represents "Neutral" and an orange bar represents "Positive." The data from the bars is as follows: Control: Neutral: 2.5. Positive: 6. Low (0.50 dollars): Neutral: 3.5. Positive: 4.5. High (15.00 dollars): Neutral: 5.8. Positive: 5.8. Note: All values are approximated.
Time taken: Seconds | Cost: 50% reduction in rates


"*" indicates required fields